Keyword Prediction is a educational web tool that explores the relationship between online search behavior and housing market trends. By combining Google Trends keyword search data with the House Price Index (HPI), this tool uses machine learning to uncover potential connections between what people are searching for online and changes in house prices. Users can input various keywords and see how their search popularity might correlate with housing market fluctuations, offering a unique perspective on the interplay between digital trends and real estate dynamics.
Tutorial
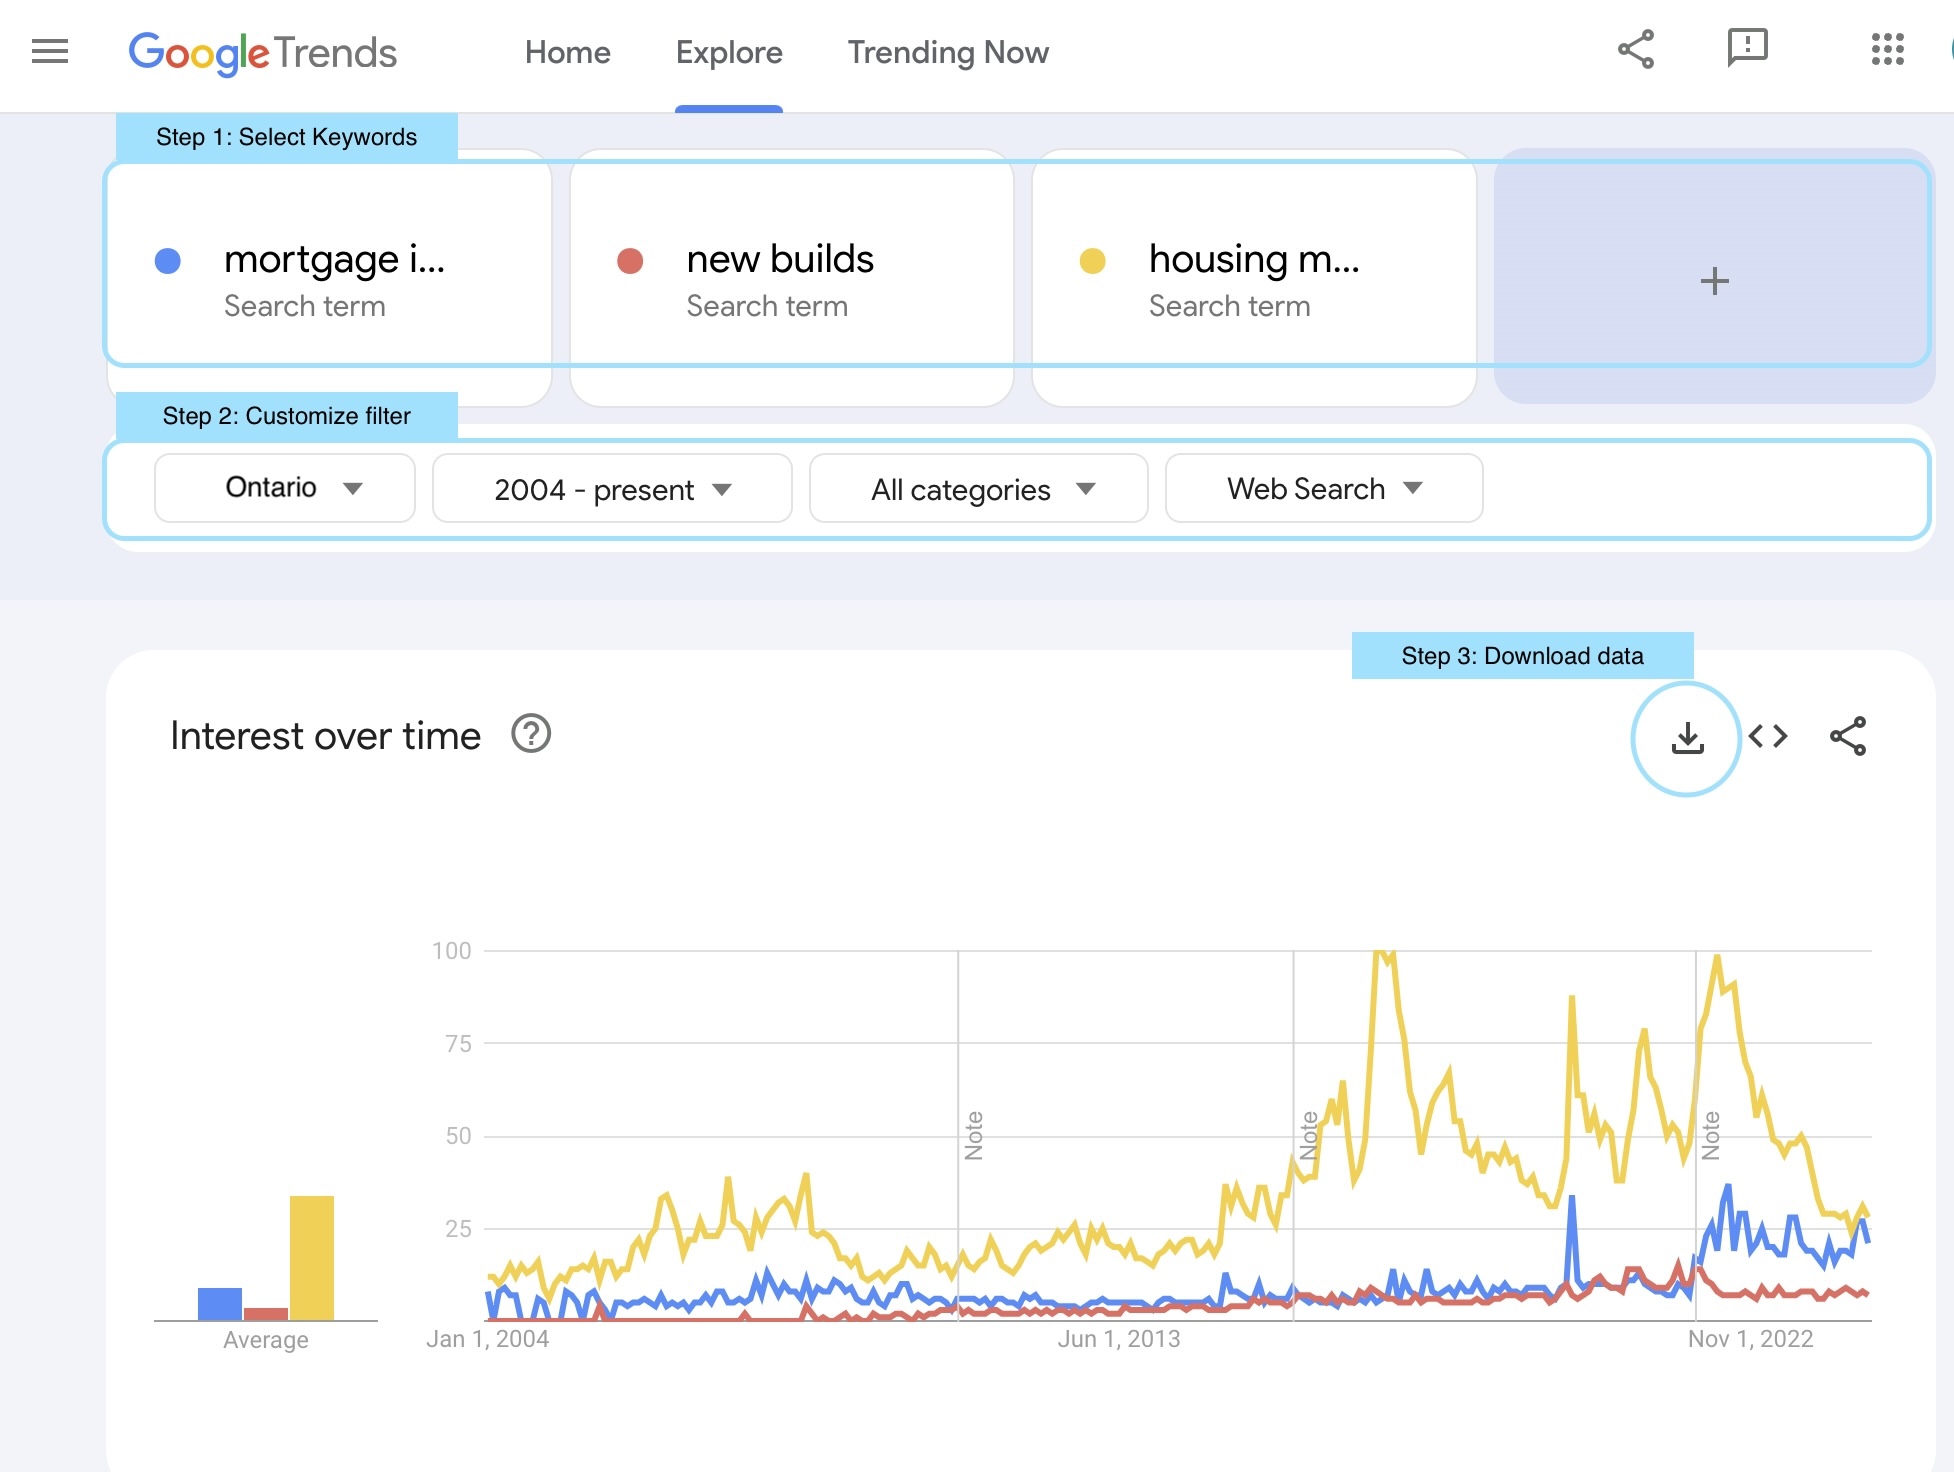
To get started, open a new browser tab, go to Google Trend, then follow the steps below:
- Simply search different keywords (1 - 20 keywords) that you think are relevant for house price changes.
- Customize your search filters to:
- Location: Ontario (the default ‘Canada’ works too but given the house price index is for Ontario, using Ontario search volume will be more insightful.)
- Timerange: select ‘2005 - present’ or customize timerange, the timerange should be longer than 6 years for enough data points; ideally the time range should be on or after January 1, 2005.
- Categories: All categories (or you can filter to tailor to your preference)
- Search type: Web Search
- If you are happy with the keywords you selected by looking at their search trend, download the data.
- On your downloaded dataset, make sure the first row is the column name and no empty row(s). The first column name should be ‘date’, and other column names are the keyword you selected.
- Upload your file to the tool below and run to see the result. It might take a few minutes to run.
Google Trend Tutorial:
Example Data File From Google Trend Download:
Please make sure:
- no empty rows in between and first column name is ‘date’;
- The ‘date’ column should contain timestamps in month intervals (e.g. ‘01/01/2005’,‘02/01/2005’,…)
- File type should be CSV (not excel ‘xlsx’ format).

Explanation
Model Input:
- X (input data): monthly search volumn for the selected 1 - 20 keywords
- Y (target variable): House Price Index by month (January 1, 2005 - latest-available-dataset)
Process:
-
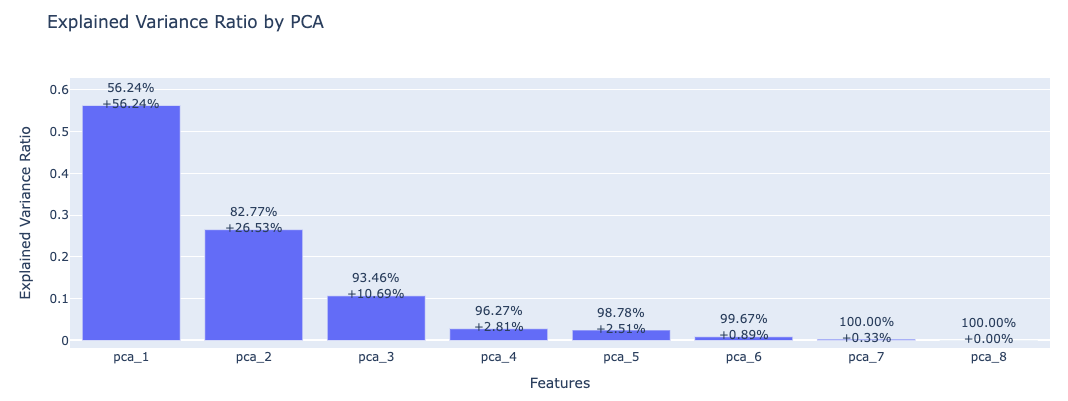
Conduct Principal Component Analysis (PCA) to conduct dimension reduction on input data
Principal Component Analysis (PCA): A statistical technique that simplifies complex datasets by identifying the most important patterns or “principal components,” allowing you to reduce the number of variables while retaining most of the information. -
Conduct Autoregressive Distributed Lag (ARDL) model to forecast House Price Index
Autoregressive Distributed Lag (ARDL) model: An econometric approach used to analyze relationships between variables over time, particularly useful when dealing with both short-term and long-term effects in time series data, making it valuable for economic and financial forecasting.
Output:
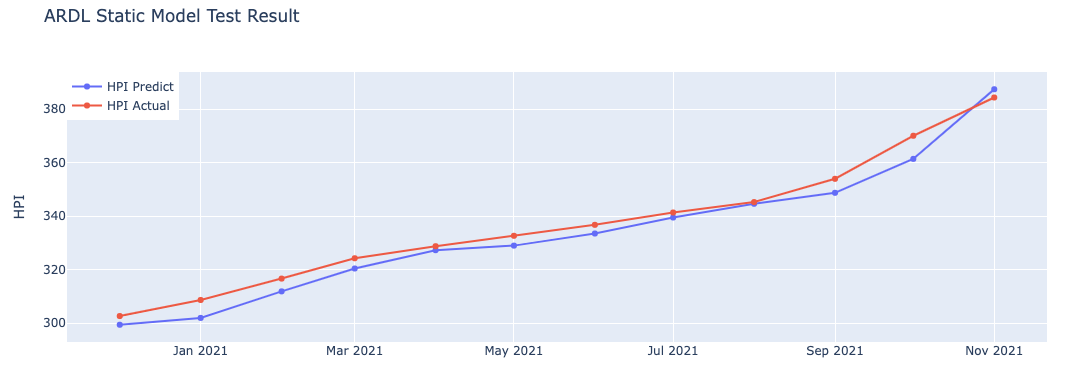
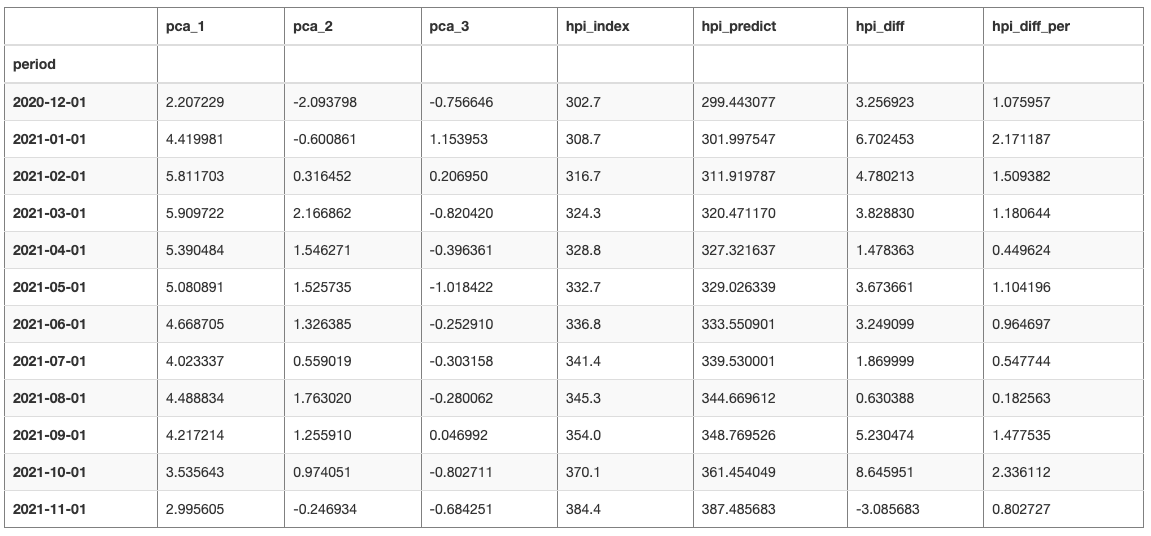
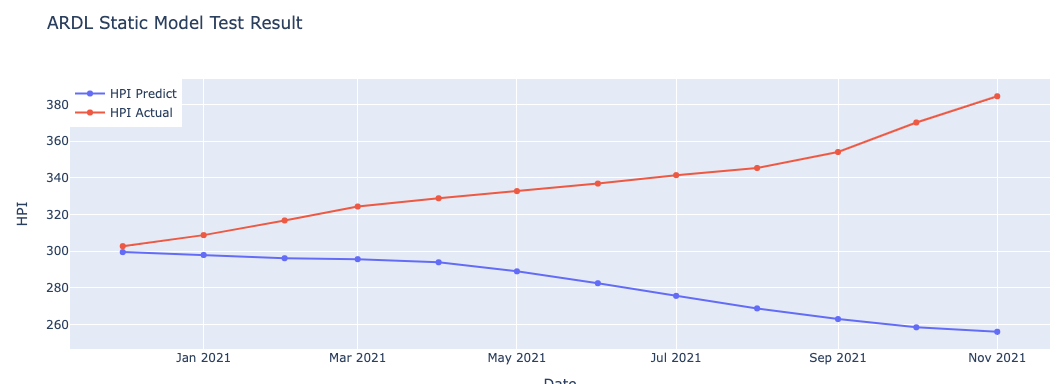
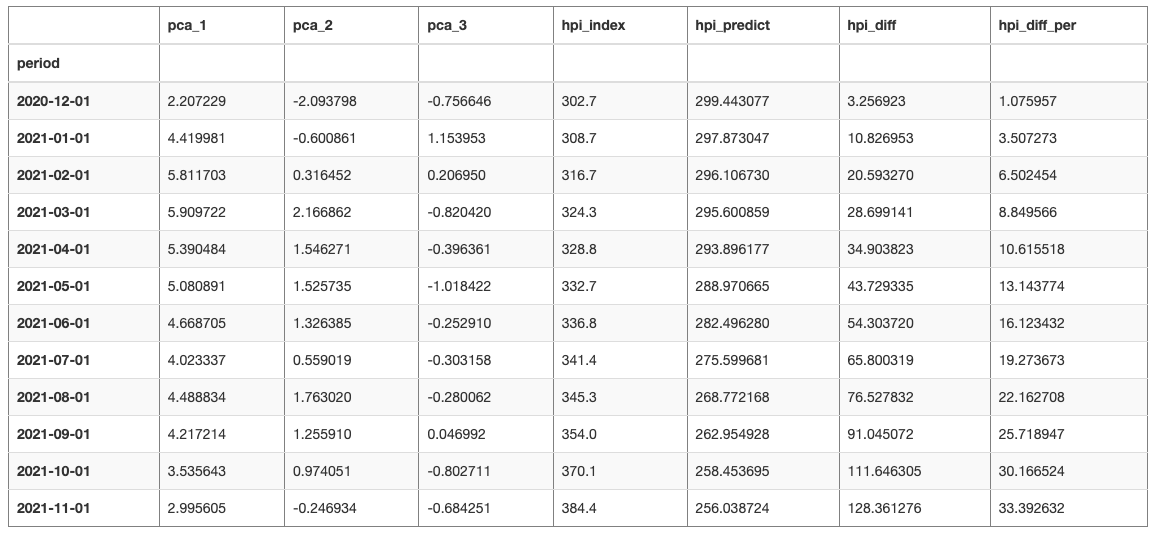
Monthly forecasting on the last-one-year House Price Index (prediction), compared against actual House Price Index (actual). Model performance is measured by Mean Average Percentage Error (MAPE).
References:
Example Output
File Uploaded Details:
-
Uploaded Files: all_search_term.csv
-
Your Google Trend data cover search volume from 2005-Jan-01 to 2021-Nov-01, with the selected keywords:
- mls listings: (Ontario)
- condos for sale: (Ontario)
- homes for sale: (Ontario)
- houses for sale: (Ontario)
- mls listings: (Ontario).1
- property for sale: (Ontario)
- real estate agent: (Ontario)
- realtor: (Ontario)
PCA Result:
Selected n_components: 3 with cumulative explained variance at 93.46%
Static ARDL Model Result
Static Model MAPE: 15.8777%
Dynamic ARDL Model Result
Dynamic Model MAPE: 1.1502%
